A NEW RESEARCH MODALITY
Qualitative depth. Quantitative scale.
For qual. For quant. And whenever you need both.
One AI-moderated method that goes as deep as qualitative or as wide as quantitative, in a single study. The reason and the number arrive together, in the decisions that need both.
Book a demo
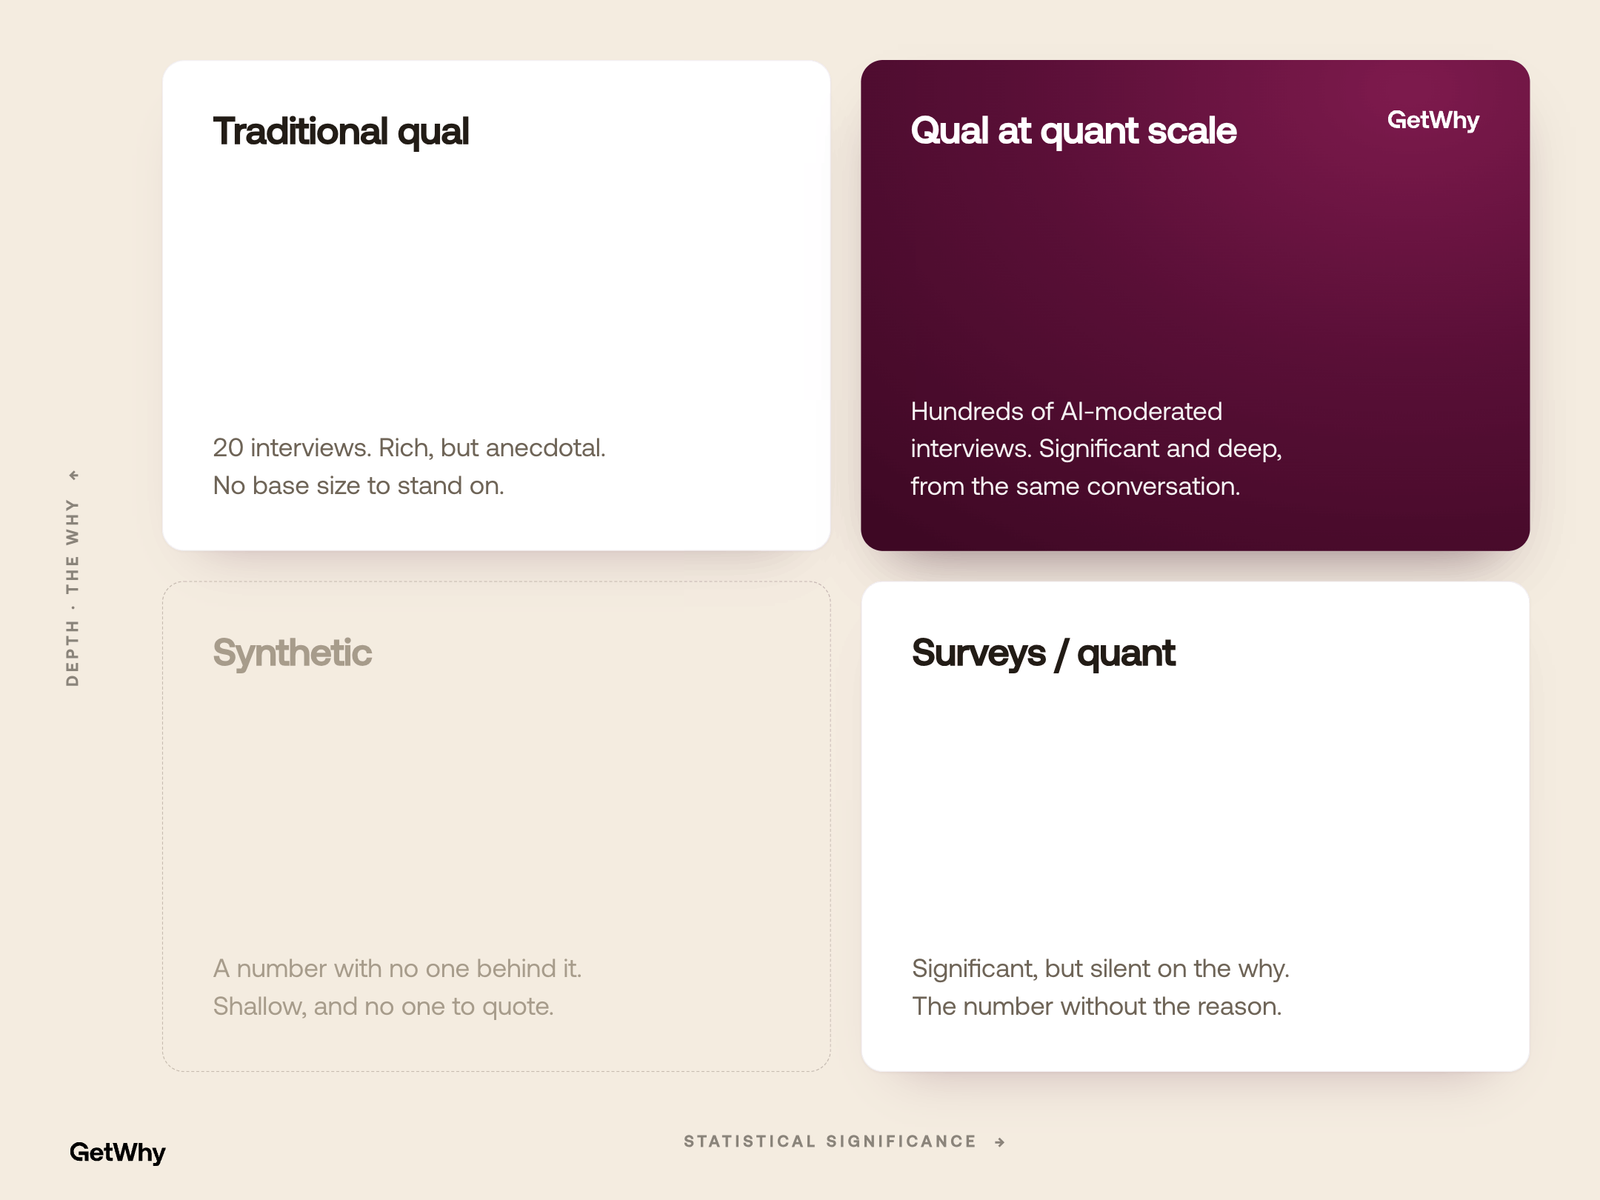
The no-tradeoff
You used to pick depth or significance. Now you keep both.
Qual was rich but anecdotal. Quant was significant but silent on the why. Synthetic gave up on both. AI moderation at scale gives you depth and significance at once.
THE NEW HYBRID INSIGHT
AI moderation collapses the qual versus quant trade-off.
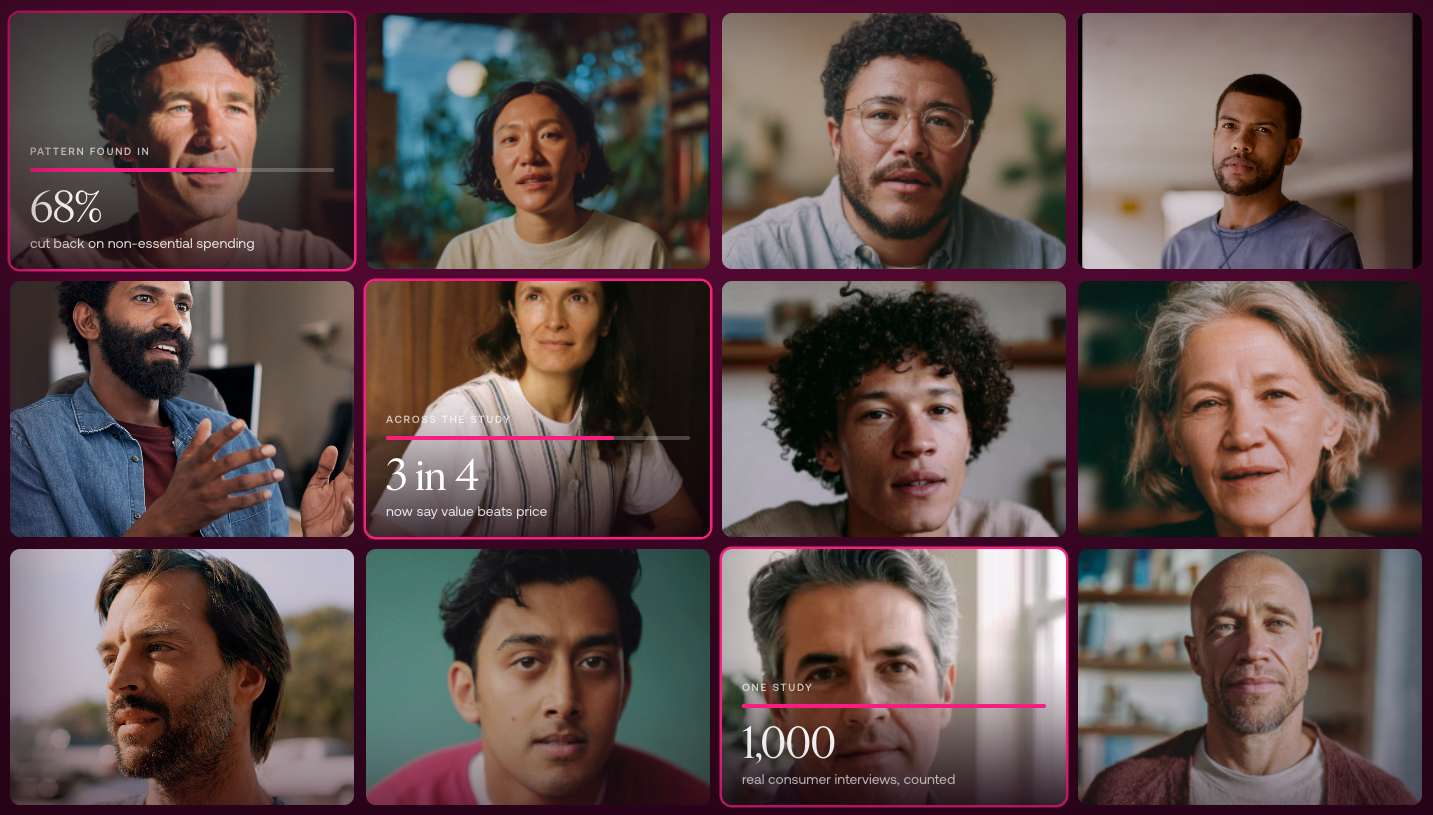
Qualitative depth at quantitative scale, in a single study. Run 100+ or more AI-moderated interviews and the base size is big enough to be significant, while the conversation still gives you the why. One study answers what you used to split across two.
The proportions, at a base size you can defend.
The reasons, in their own words, on video.
Both from one study. The number and the why, together.
HOW IT WORKS
One brief in. The numbers and the “why” out.
01
Design the study once.
One brief, one guide. No separate quant and qual projects to stitch together later.

02
Recruit verified real people.
300+ million video-ready participants across 100+ markets, orchestrated automatically. 8-step Quality Assurance filters out bots, fraud, and disengaged respondents. No synthetic stand-ins, ever.

03
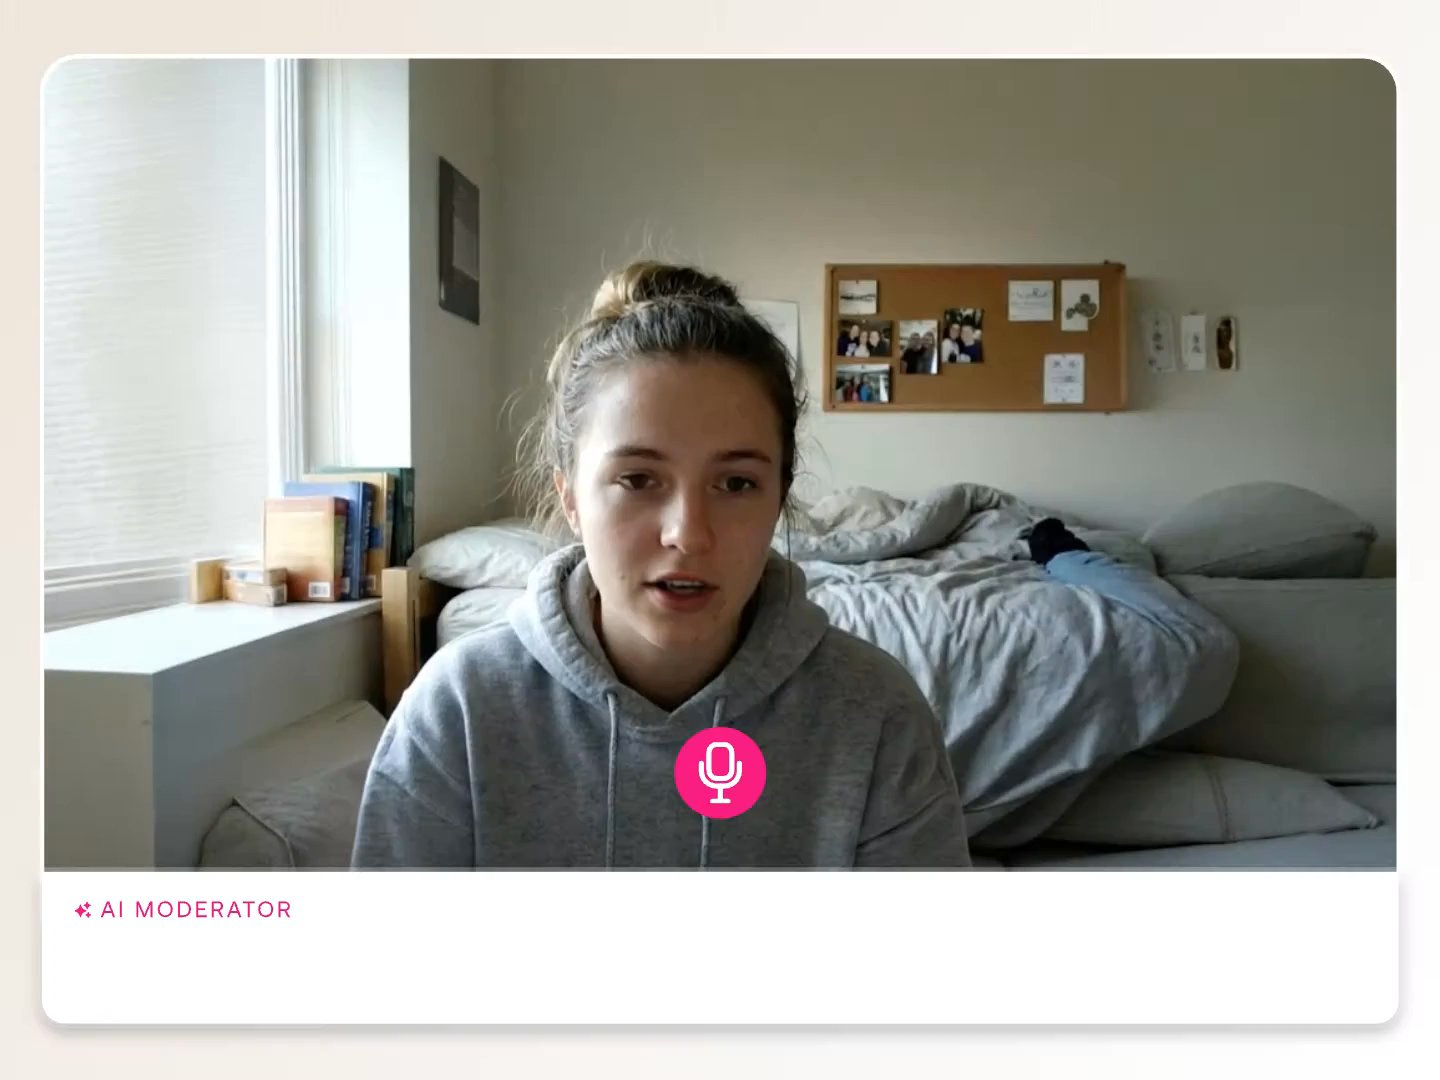
AI moderates every conversation.
It follows the 17-point quality standard, and digs into the why in each person’s own language.
04
Get one dataset back.
Quant and qual in one dataset: the numbers, and the conversations behind them. Charts you can drop straight into your deck.

“It is much more consumable than a big, dusty, 50-page report.”
Mireille Patoine
Strategic Customer Insights Lead, Maersk
Every quant view, with the qual behind it
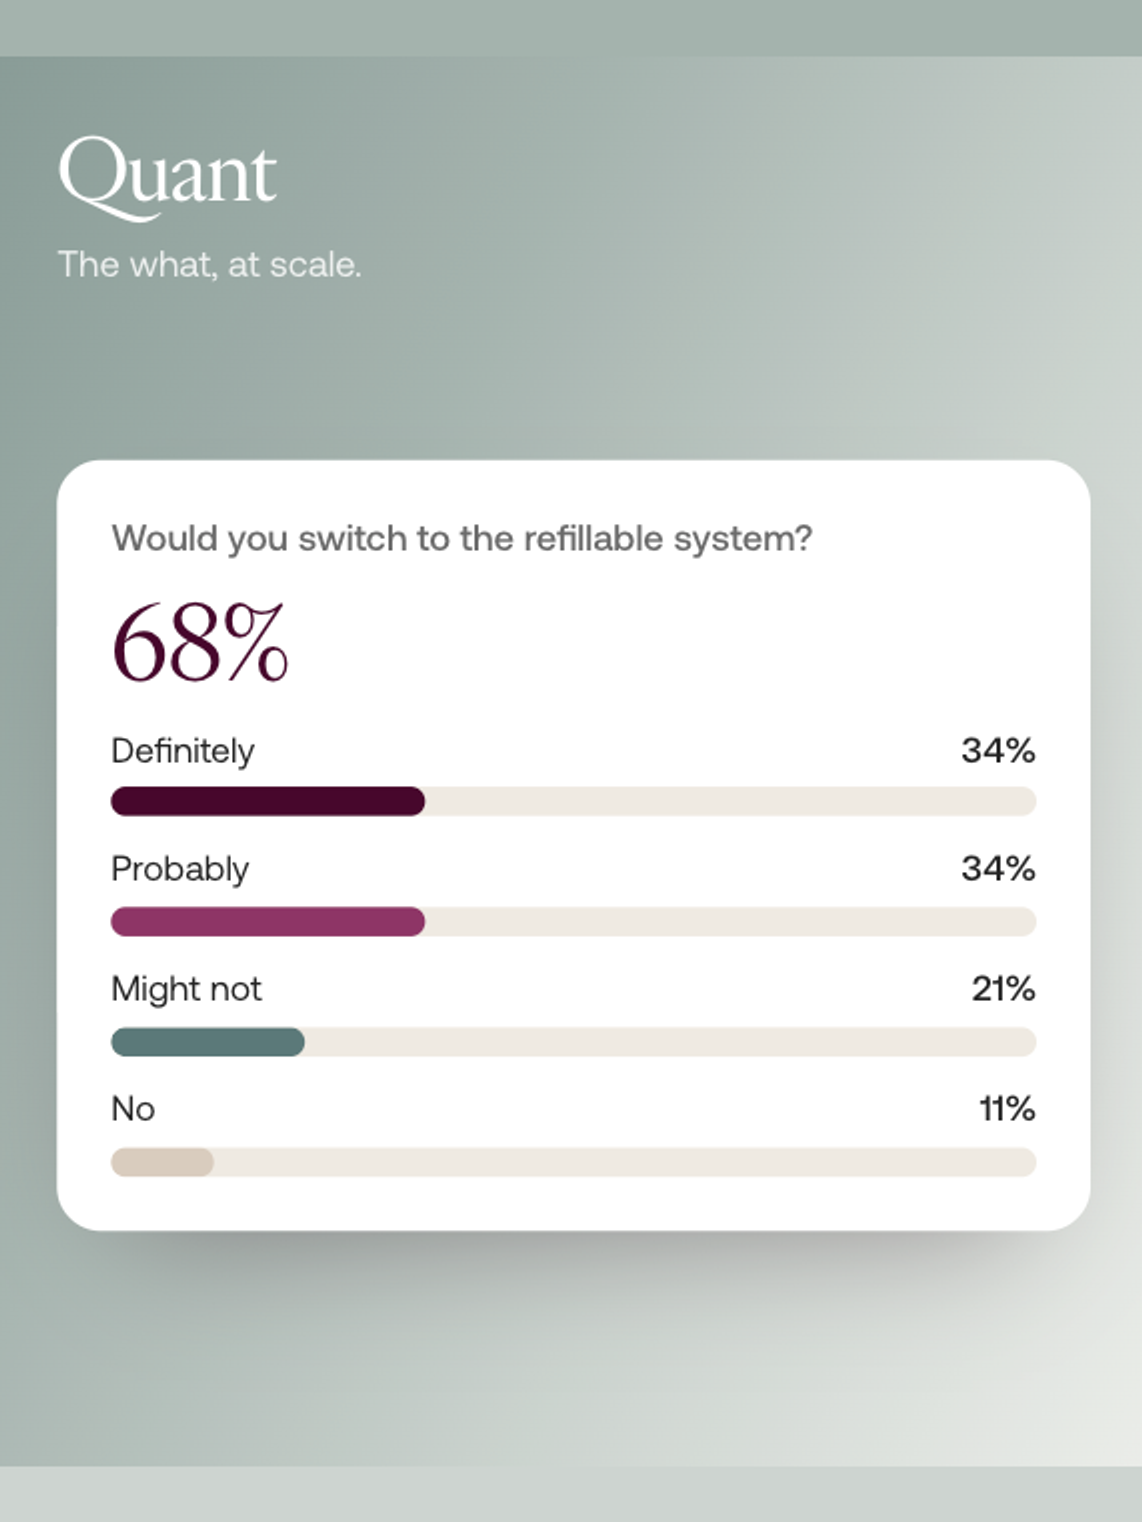
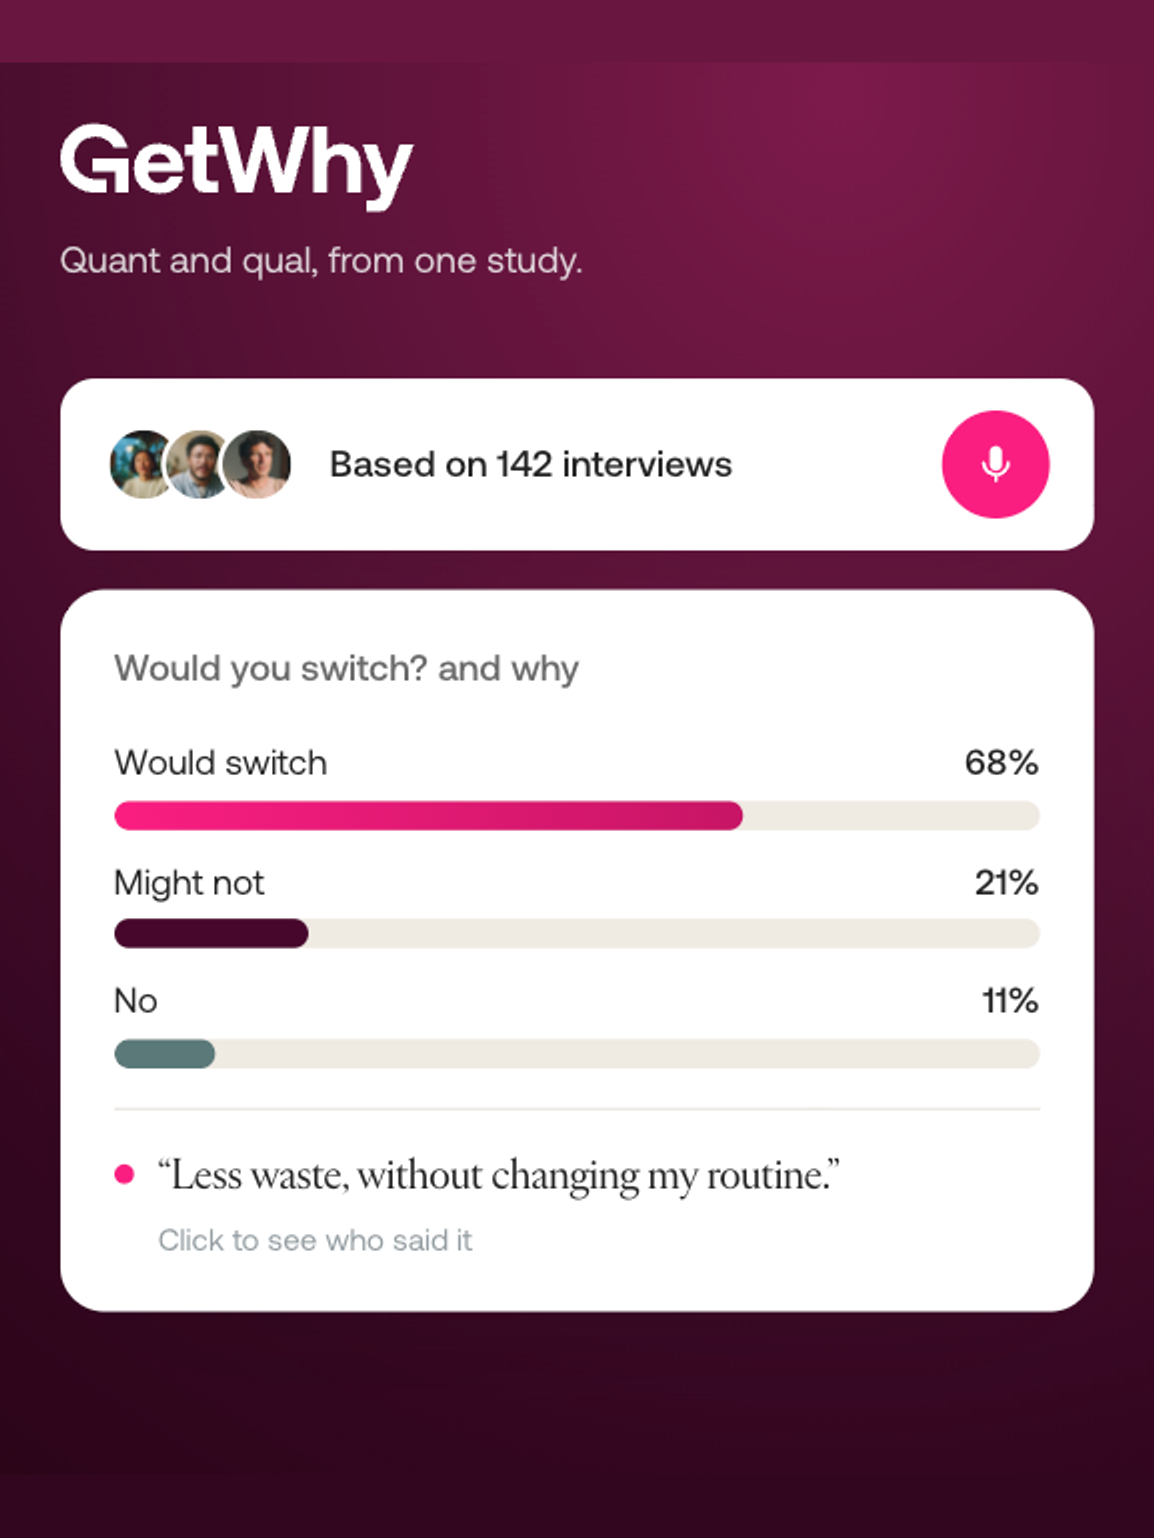
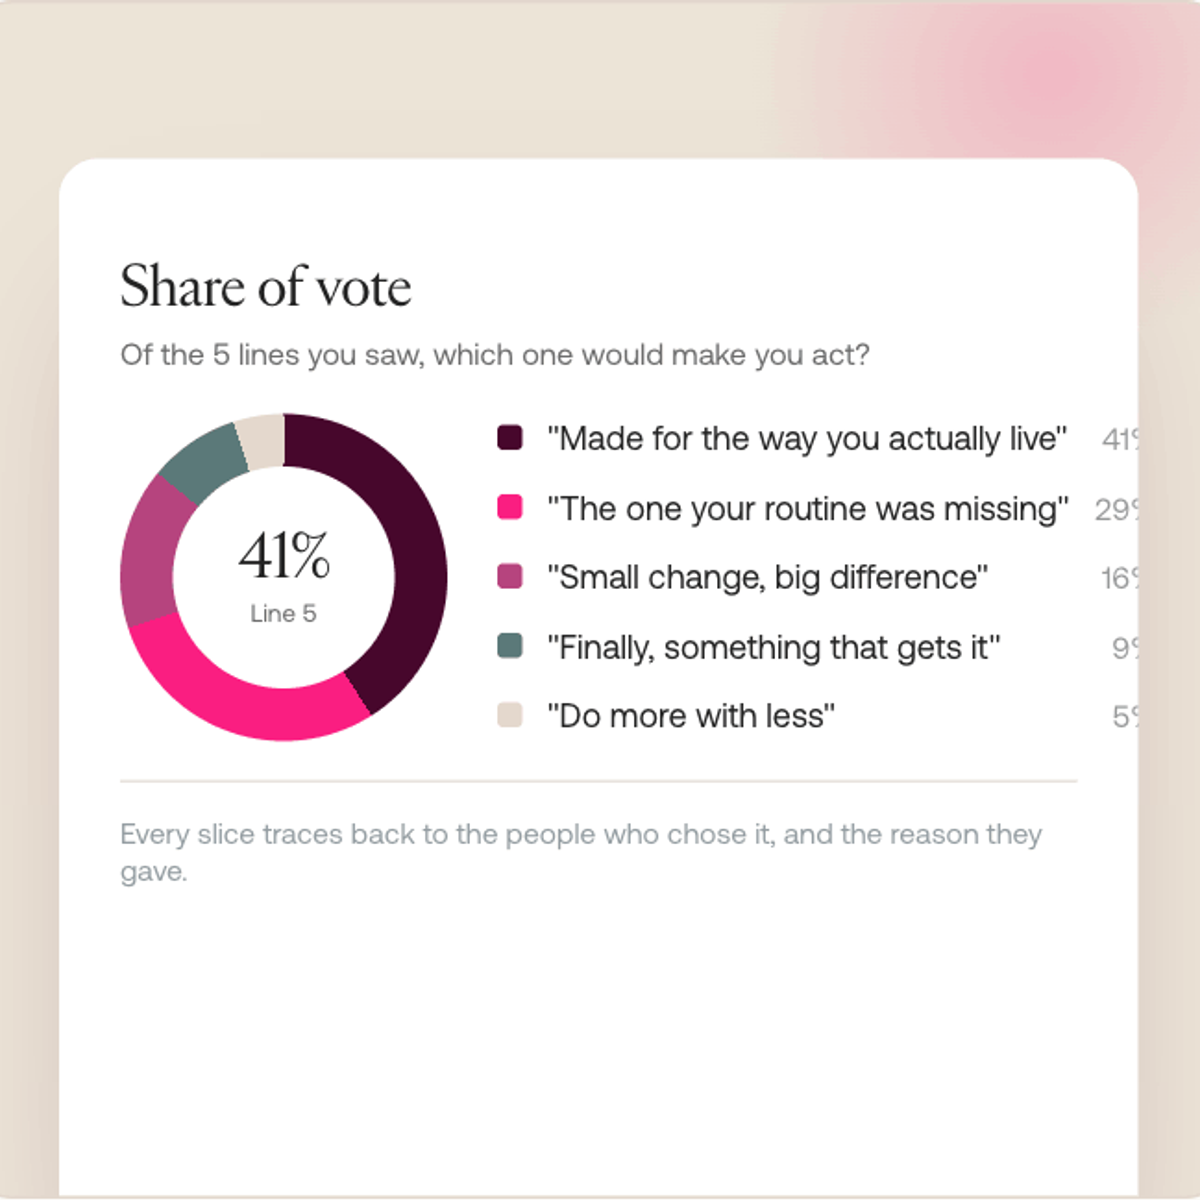
Single-choice, as share of vote
Single-choice answers come back as share. What proportion chose what, with every slice traceable to the people who chose it and the reason they gave.
Single-choice answers come back as share. What proportion chose what, with every slice traceable to the people who chose it and the reason they gave.
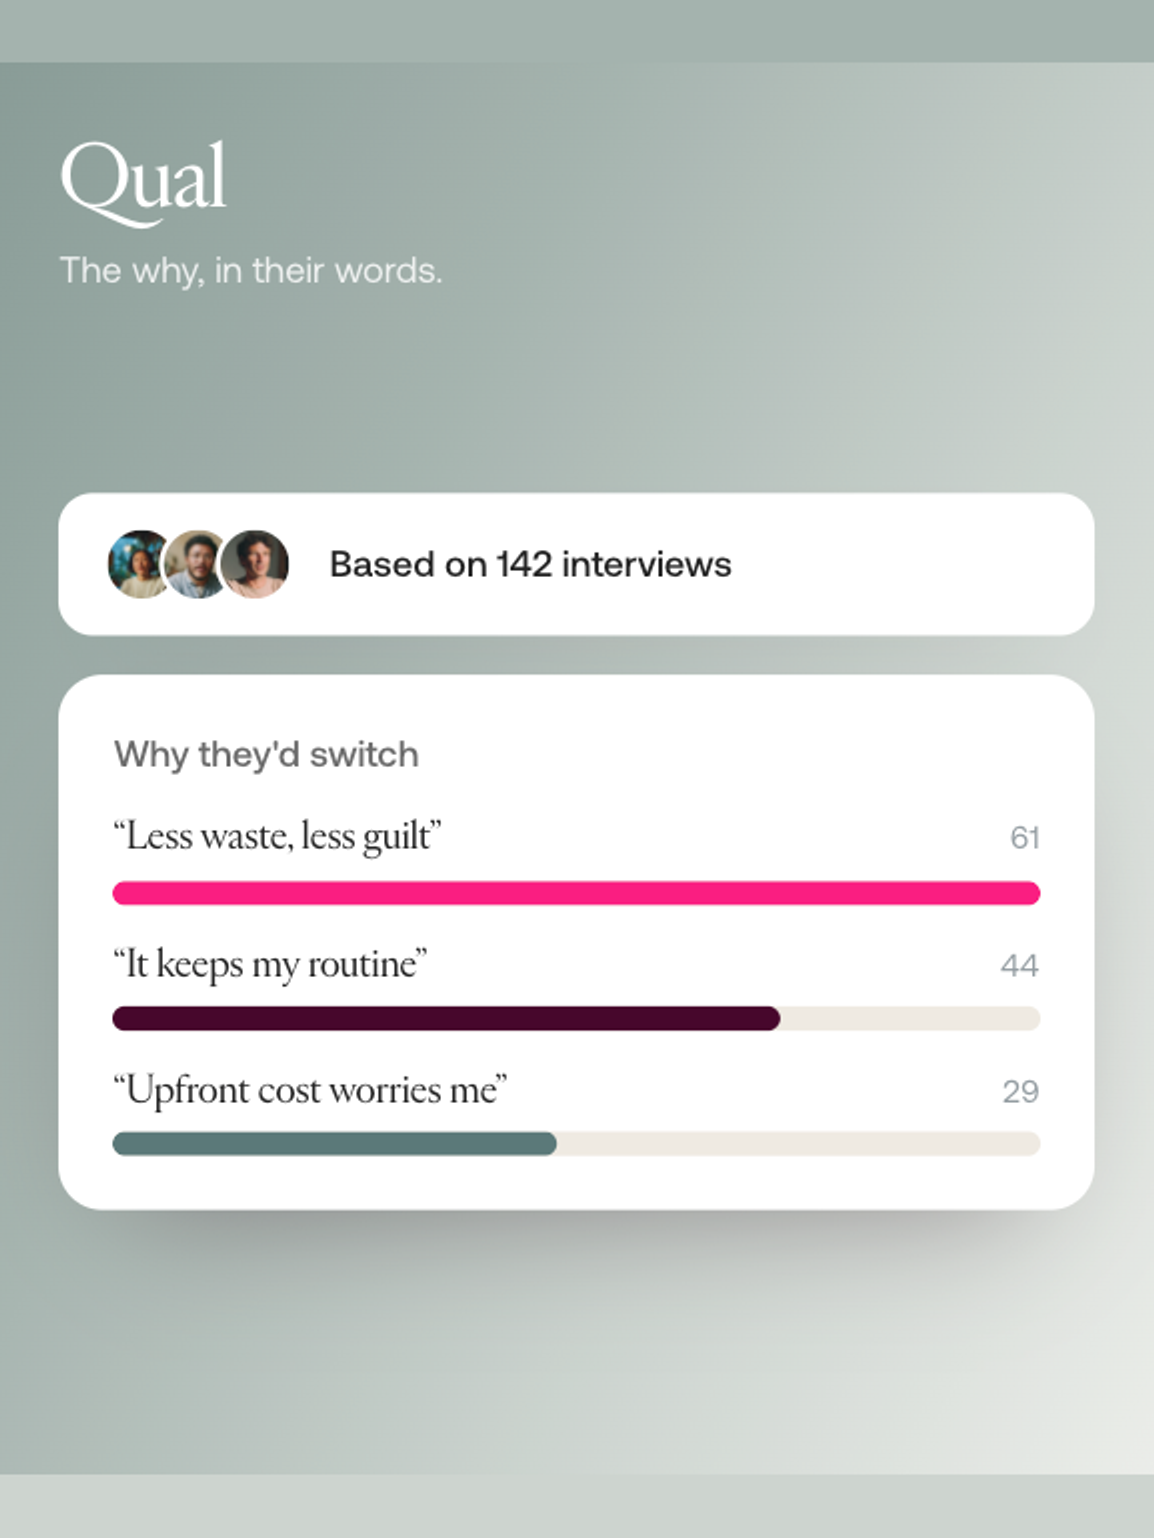
Multi-select and scales, ranked
Multi-select and scaled answers, ordered by distance. What ranks, and by how far, with the interviews behind each bar one click away.

Multi-select and scaled answers, ordered by distance. What ranks, and by how far, with the interviews behind each bar one click away.
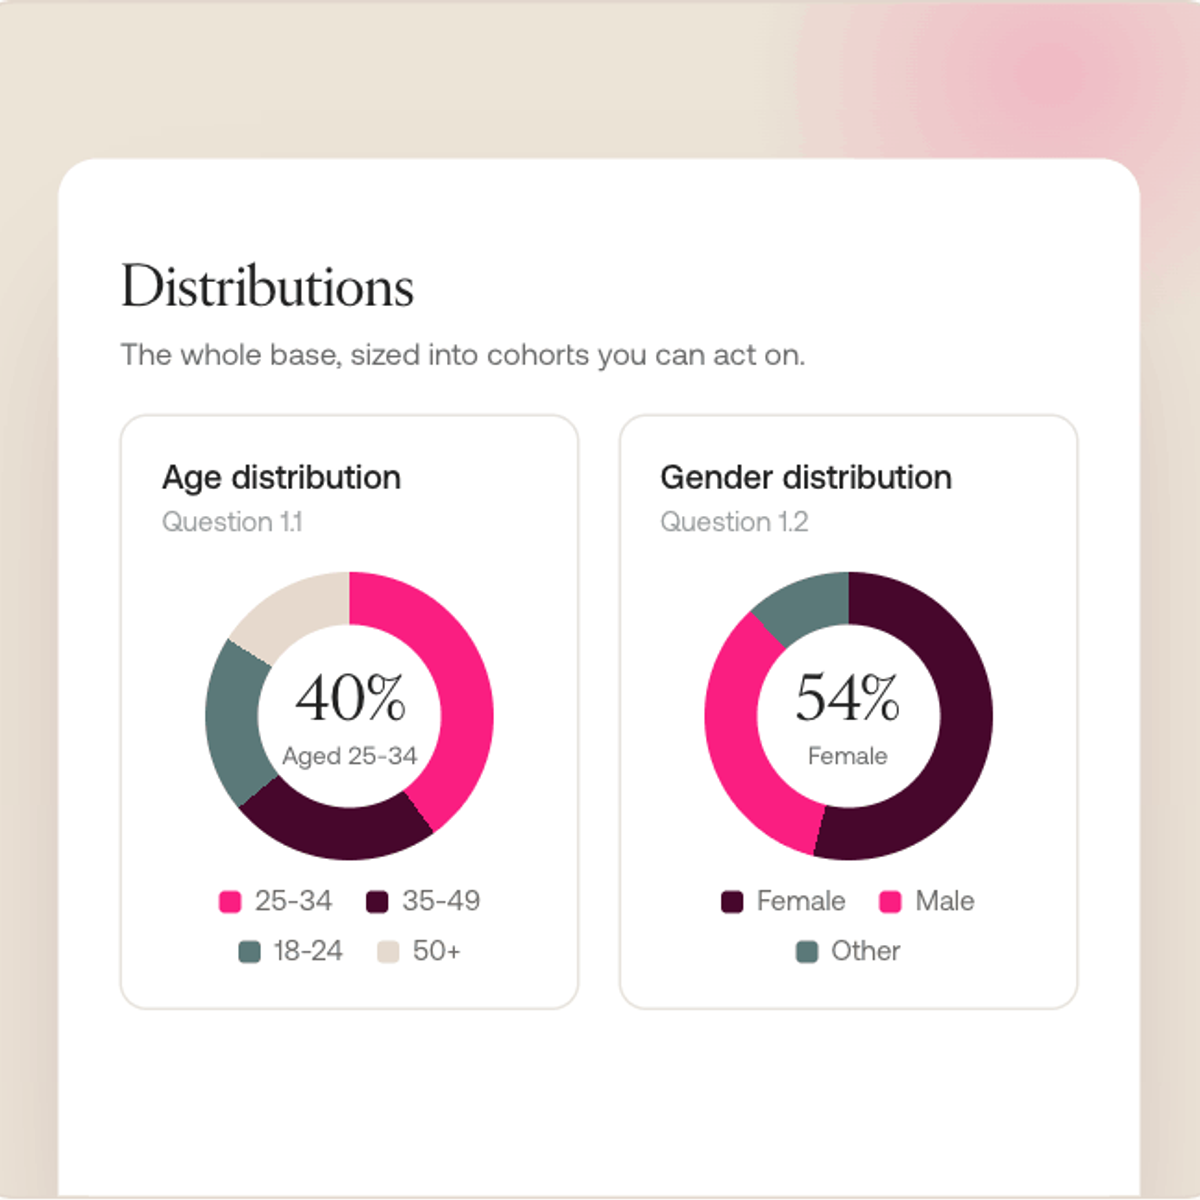
Every distribution, on one dashboard
Age, gender, devices, themes, market splits. Every quantifiable answer on one screen, sliceable by segment and market.
Age, gender, devices, themes, market splits. Every quantifiable answer on one screen, sliceable by segment and market.
Quotes behind every number
Nothing is asserted without a human behind it. The quote library is searchable and filterable by question, segment, market, or theme.

Nothing is asserted without a human behind it. The quote library is searchable and filterable by question, segment, market, or theme.
Interviews recorded in full
Every interview recorded, transcribed, and searchable. The human foundation under every chart, ready to build into showreels.

Every interview recorded, transcribed, and searchable. The human foundation under every chart, ready to build into showreels.
CUSTOM DATA VISUALIZATION
Built for the way your business reads.
Every business speaks its own language, and every leader reads the numbers their own way. Tell us how yours works, and we will shape the data into the views that land in your rooms.
Where you need both at once
And anywhere else you need depth and scale: claims testing, pack and design, pricing and willingness to pay, ad and creative testing, brand and campaign tracking.
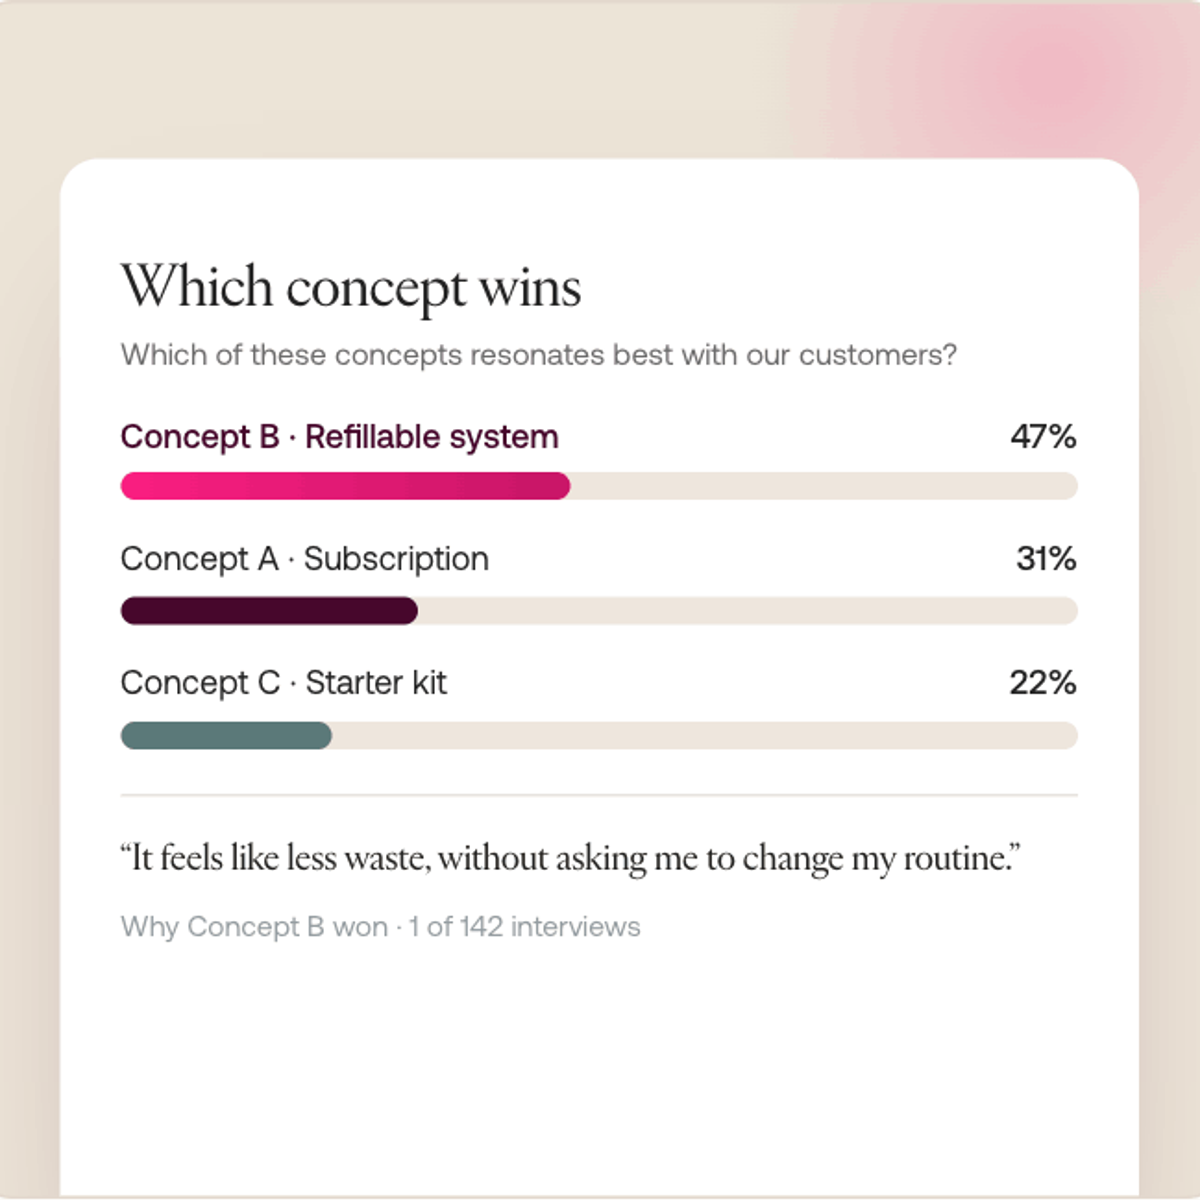
CONCEPT SCREEN
Which concept wins
Several ideas. Which one wins, and the reason it won.
SEGMENTATION
Size every cohort
Whole base. Cohorts you can size and explain.
POSITIONING
The line that moves people
Message test. Which line moves people, and how many.
Why it matters
At eBay, GetWhy delivered 2.4x more feedback per question and a 40 to 50% increase in depth of data, while running at a scale the team could act on across eight markets.
Feedback per question
2.4x
More feedback per question than the previous method
Depth of data
40-50%
Increase in the depth of data captured
Markets
8
A scale the team could act on, across eight markets
Feedback per question
2.4x
More feedback per question than the previous method
Depth of data
40-50%
Increase in the depth of data captured
Markets
8
A scale the team could act on, across eight markets
GET STARTED
Run one study. Get both answers.
Bring the question you’d normally split into a quant screen and a qual follow-up. We’ll design it as one study on the call.